Project:Customer Segmentation using Machine learning
Machine learning in python:
Machine learning is a type of artificial intelligence (AI) that provides computers with the ability to learn without being explicitly programmed. Machine learning focuses on the development of Computer Programs that can change when exposed to new data. n of a simple machine learning algorithm using python.
Python community has developed many modules to help programmers implement machine learning.
CUSTOMER SEGMENTATION:
Customer Segmentation can be a powerful means to identify unsatisfied customer needs. This technique can be used by companies to outperform the competition by developing uniquely appealing products and services.

Customer Segmentation is the subdivision of a market into discrete customer groups that share similar characteristics. Customer Segmentation can be a powerful means to identify unsatisfied customer needs. Using the above data companies can then outperform the competition by developing uniquely appealing products and services.
The most common ways in which businesses segment their customer base are:
1.Demographic information, such as gender, age, familial and marital status, income, education, and occupation.
2.Geographical information, which differs depending on the scope of the company. For localized businesses, this info might pertain to specific towns or counties. For larger companies, it might mean a customer’s city, state, or even country of residence.
3.Psychographics, such as social class, lifestyle, and personality traits.
4.Behavioral data, such as spending and consumption habits, product/service usage, and desired benefits.
Advantages of Customer Segmentation:
-
Determine appropriate product pricing.
-
Develop customized marketing campaigns.
-
Design an optimal distribution strategy.
-
Choose specific product features for deployment.
-
Prioritize new product development efforts.
The goal of this project is to:
- Perform an exploratory analysis on the dataset.
- Check that the assumptions K-means makes are fulfilled.
- Apply K-means clustering algorithm in order to segment customers.
K Means Clustering Algorithm
K-Means clustering is a type of unsupervised learning. The main goal of this algorithm to find groups in data and the number of groups is represented by K. It is an iterative procedure where each data point is assigned to one of the K groups based on feature similarity.
->k-means is one of the simplest unsupervised learning algorithms that solve the well known clustering problem. The procedure follows a simple and easy way to classify a given data set through a certain number of clusters (assume k clusters) fixed apriori. The main idea is to define k centers, one for each cluster. These centers should be placed in a cunning way because of different location causes different result. So, the better choice is to place them as much as possible far away from each other. The next step is to take each point belonging to a given data set and associate it to the nearest center. When no point is pending, the first step is completed and an early group age is done. At this point we need to re-calculate k new centroids as barycenter of the clusters resulting from the previous step. After we have these k new centroids, a new binding has to be done between the same data set points and the nearest new center. A loop has been generated. As a result of this loop we may notice that the k centers change their location step by step until no more changes are done or in other words centers do not move any more. Finally, this algorithm aims at minimizing an objective function know as squared error function given by:

where,
                       ‘||xi - vj||’ is the Euclidean distance between xi and vj.

                       ‘ci’ is the number of data points in ith cluster.

                       ‘c’ is the number of cluster centers
The algorithm works as follows:
-
First we initialize k points, called means, randomly.
-
We categorize each item to its closest mean and we update the mean’s coordinates, which are the averages of the items categorized in that mean so far.
-
We repeat the process for a given number of iterations and at the end, we have our clusters
Broad steps for K Means algorithm:
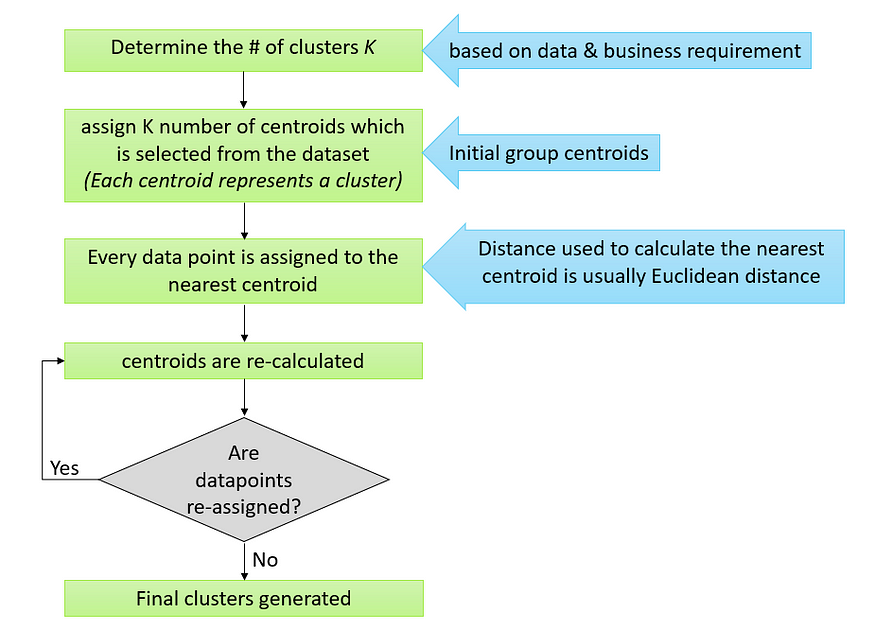
Implementing K Means Algorithm
This project is a part of the Mall Customer Segmentation Data competitionheld on Kaggle.
The dataset can be downloaded from the kaggle website which can be found here
The steps involved in implementing K means are:
1. Importing required libraries->
Machine Learning, as the name suggests, is the science of programming a computer by which they are able to learn from different kinds of data.
Python libraries are specific files containing pre-written code that can be imported into your code base by using Python’s import feature. … A Python framework can be a collection of libraries intended to build a model (e.g., machine learning) easily, without having to know the details of the underlying algorithms.
import numpy as np
import pandas as pd
import matplotlib.pyplot as plt
import seaborn as sns
from sklearn.decomposition import PCA
2. Accessing the dataset->
The required dataset is accessed in order to analyze and build the necessary model for achieving the overall objective of the problem.
df = pd.read_csv("Customer_data.csv")
df.head()

3. Analyzing the dataset->
At this point, we have enough sample data to work with. Let’s start by finding the correlation between different variables. First we’ll create a scatter plot, and relate the values for two variables of each row. In our code, we also customize the look by defining the font and figure size and colors of the points with matplotlib.
Basically we are preprocessing the data.
Data Preprocessing for Machine learning in Python:
Data Preprocessing is a technique that is used to convert the raw data into a clean data set. In other words, whenever the data is gathered from different sources it is collected in raw format which is not feasible for the analysis.
ss1_20 = df["Spending Score (1-100)"][(df["Spending Score (1-100)"] >= 1) & (df["Spending Score (1-100)"] <= 20)]
ss21_40 = df["Spending Score (1-100)"][(df["Spending Score (1-100)"] >= 21) & (df["Spending Score (1-100)"] <= 40)]
ss41_60 = df["Spending Score (1-100)"][(df["Spending Score (1-100)"] >= 41) & (df["Spending Score (1-100)"] <= 60)]
ss61_80 = df["Spending Score (1-100)"][(df["Spending Score (1-100)"] >= 61) & (df["Spending Score (1-100)"] <= 80)]
ss81_100 = df["Spending Score (1-100)"][(df["Spending Score (1-100)"] >= 81) & (df["Spending Score (1-100)"] <= 100)]

ssx = ["1-20", "21-40", "41-60", "61-80", "81-100"]
ssy = [len(ss1_20.values), len(ss21_40.values), len(ss41_60.values), len(ss61_80.values), len(ss81_100.values)]

plt.figure(figsize=(15,6))
sns.barplot(x=ssx, y=ssy, palette="nipy_spectral_r")
plt.title("Spending Scores")
plt.xlabel("Score")
plt.ylabel("Number of Customer Having the Score")
plt.show()
4. Implementing K means algorithm->
Next I plotted Within Cluster Sum Of Squares (WCSS) against the the number of clusters (K Value) to figure out the optimal number of clusters value. WCSS measures sum of distances of observations from their cluster centroids which is given by the below formula.
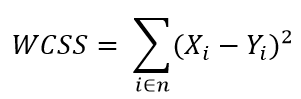
where Yi is centroid for observation Xi. The main goal is to maximize number of clusters and in limiting case each data point becomes its own cluster centroid
from sklearn.cluster import KMeans
wcss = []
for k in range(1,11):
    kmeans = KMeans(n_clusters=k, init="k-means++")
    kmeans.fit(df.iloc[:,1:])
    wcss.append(kmeans.inertia_)
plt.figure(figsize=(12,6))
plt.grid()
plt.plot(range(1,11),wcss, linewidth=2, color="red", marker ="8")
plt.xlabel("K Value")
plt.xticks(np.arange(1,11,1))
plt.ylabel("WCSS")
plt.show()
5. Visualizing the Clusters->
The Elbow Method:
Calculate the Within Cluster Sum of Squared Errors (WSS) for different values of k, and choose the k for which WSS first starts to diminish. In the plot of WSS-versus k, this is visible as an elbow.
The optimal K value is found to be 5 using the elbow method.
Finally I made a 3D plot to visualize the spending score of the customers with their annual income. The data points are separated into 5 classes which are represented in different colours as shown in the 3D plot.
km = KMeans(n_clusters=5)
clusters = km.fit_predict(df.iloc[:,1:])
df["label"] = clusters

from mpl_toolkits.mplot3d import Axes3D
import matplotlib.pyplot as plt
import numpy as np
import pandas as pd

fig = plt.figure(figsize=(20,10))
ax = fig.add_subplot(111, projection='3d')
ax.scatter(df.Age[df.label == 0], df["Annual Income (k$)"][df.label == 0], df["Spending Score (1-100)"][df.label == 0], c='blue', s=60)
ax.scatter(df.Age[df.label == 1], df["Annual Income (k$)"][df.label == 1], df["Spending Score (1-100)"][df.label == 1], c='red', s=60)
ax.scatter(df.Age[df.label == 2], df["Annual Income (k$)"][df.label == 2], df["Spending Score (1-100)"][df.label == 2], c='green', s=60)
ax.scatter(df.Age[df.label == 3], df["Annual Income (k$)"][df.label == 3], df["Spending Score (1-100)"][df.label == 3], c='orange', s=60)
ax.scatter(df.Age[df.label == 4], df["Annual Income (k$)"][df.label == 4], df["Spending Score (1-100)"][df.label == 4], c='purple', s=60)
ax.view_init(30, 185)
plt.xlabel("Age")
plt.ylabel("Annual Income (k$)")
ax.set_zlabel('Spending Score (1-100)')
plt.show()
With the help of clustering, we can understand the variables much better, prompting us to take careful decisions. With the identification of customers, companies can release products and services that target customers based on several parameters like income, age, spending patterns, etc. Furthermore, more complex patterns like product reviews are taken into consideration for better segmentation.
We have thus seen, how we could arrive at meaningful insights and recommendations by using clustering algorithms to generate customer segments. For the sake of simplicity, the dataset used only 2 variables — income and spend. In a typical business scenario, there could be several variables which could possibly generate much more realistic and business-specific insights.
Environment and tools:
- scikit-learn
- seaborn
- numpy
- pandas
- matplotlib
In this data science project, we went through the customer segmentation model. We developed this using a class of machine learning known as unsupervised learning.
Specifically, we made use of a clustering algorithm called K-means clustering. We analyzed and visualized the data and then proceeded to implement our algorithm. Hope you enjoyed this customer segmentation project of machine learning using python.